Multi-Property Plots
This special type of plot shows several mixture properties together for:
Each solid phase in equilibrium with liquid forms a separate property, the same applies to liquid 1 and liquid 2 compositions in LLE, and liquid and vapor compositions in VLE. They can be accessed separately through the Navigation tree. Multi-property plots combine them.
The plots are available from the Experimental and Predicted Data, Multi-Property Equations, and Calculated with Multi-Property Equations nodes of the mixture Navigation trees. The functionality and features are the same as those for plots for 1 variable or 2 variables.
Examples:
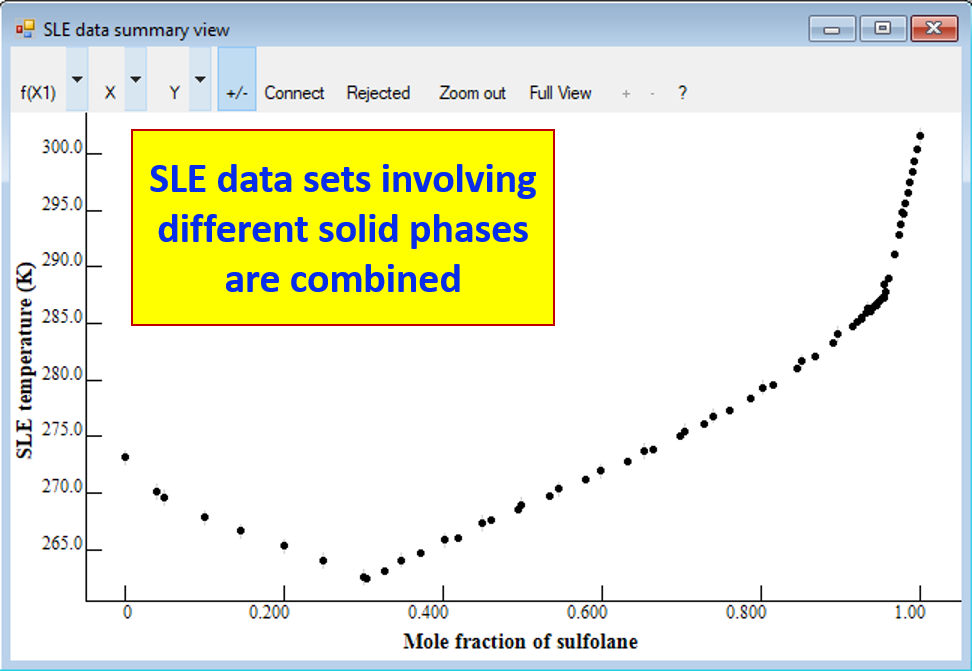
SLE (sulfolane + water)
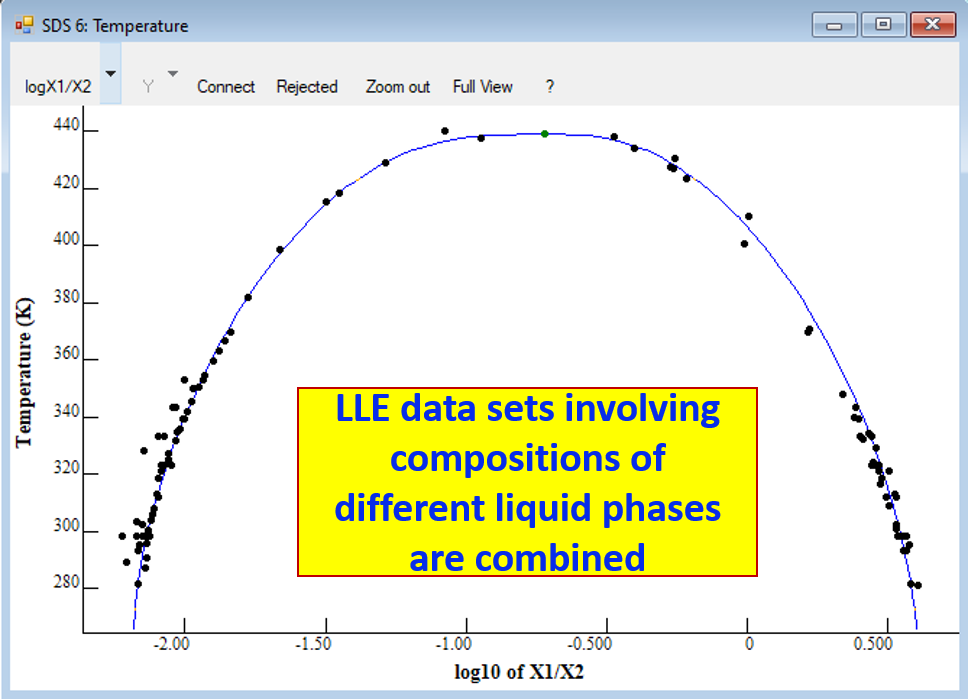
LLE (aniline + water in the composition-stretched coordinates)
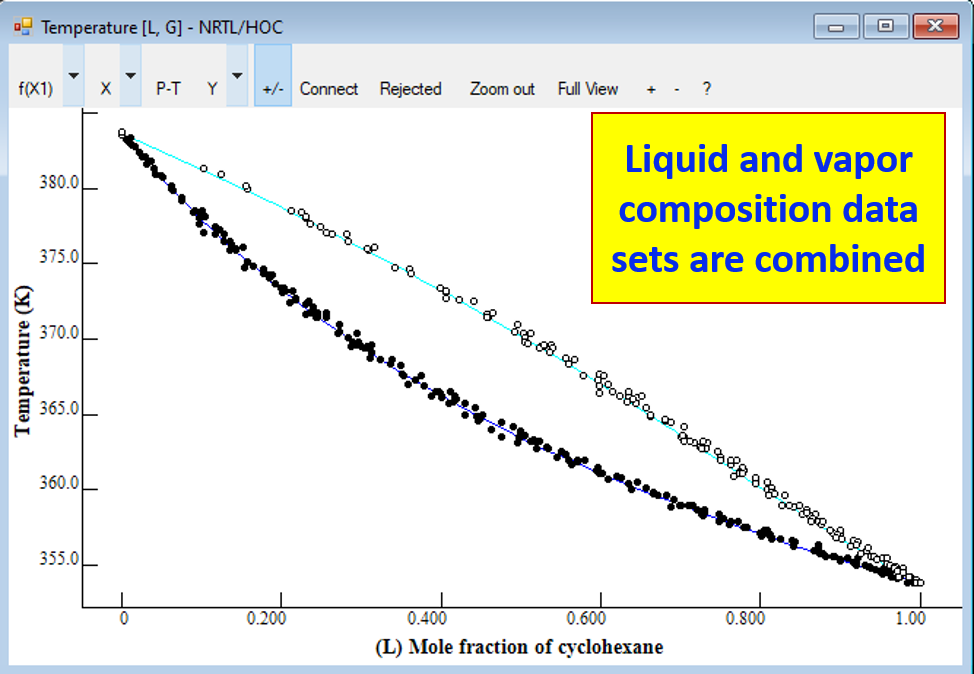
VLE (cyclohexane + toluene at 101 kPa)