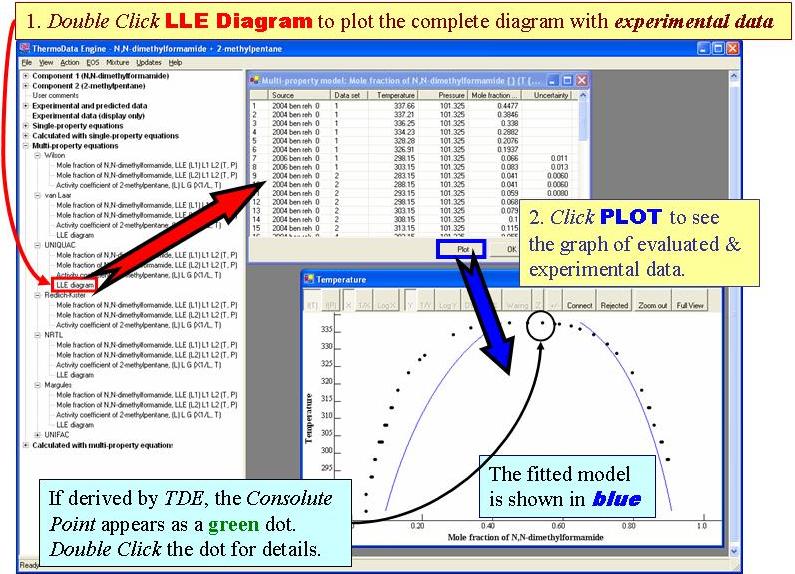
Display of calculated LLE Diagram (with experimental data & fitted model)
The plot shows isobaric (p = 101.3 kPa) LLE data & model fit for the system (2-methylpentane + N,N-dimethylformamide).
Numerous Plot Exploration Features are available.
The plot shows isobaric (p = 101.3 kPa) LLE data & model fit for the system (2-methylpentane + N,N-dimethylformamide).
Numerous Plot Exploration Features are available.