Display of Azeotropic Data (with experimental data & fitted model)
Azeotropic results (experimental data & evaluated curves) are displayed as shown here.
Plots of Evaluated Data at even temperature and pressure increments are accessed through the Calculated with Multi-Property Equations tree node.
The plot shows isothermal VLE data (with an azeotrope) for the system (methyl ethanoate + methyl tert-butyl ether).
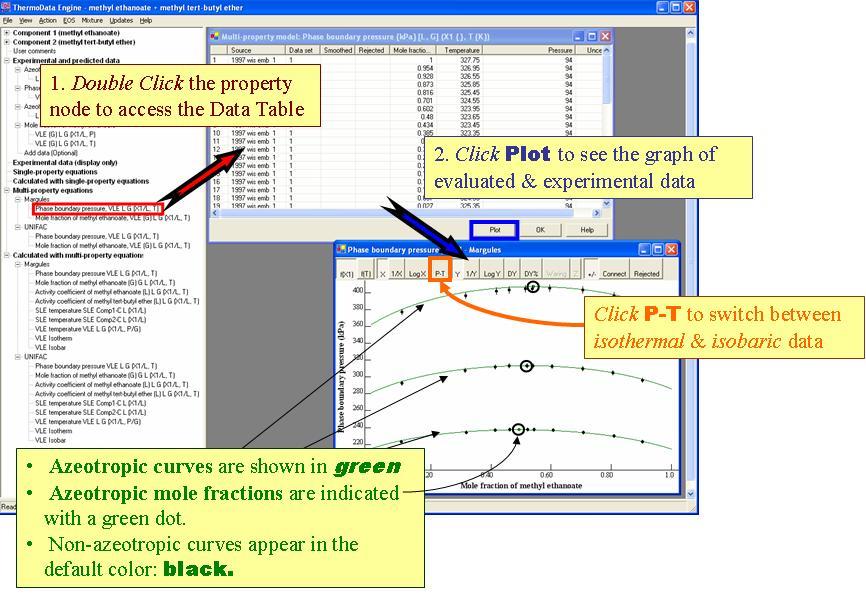
Numerous Plot Exploration Features are available.