Calculated with Multi-Property Equations: Azeotropic Data

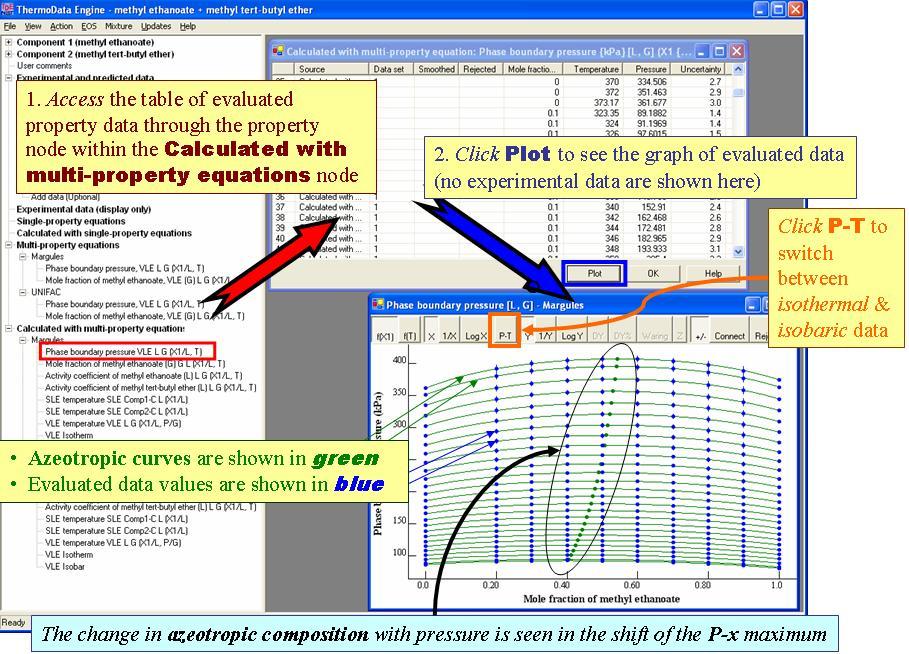
Plots of calculated property values for azeotropic systems include special display features

example of how to display plot of azeotropic data calculated with multi-property equations: double click a phase boundary pressure end node under Calculated with multi-property equations, then click Plot. Azeotropic curves are shown as green curves, calculated data as boue points, and azeotropic compositions as green points. Use the P-T button to switch between isothermal and isobaric data.