Data as a function of 2 variables
Available actions are controlled through the tool bar.
PLOT TYPES:
DY: Deviation Plot , DY%: %Deviation Plot
PLOT FEATURES:
+/-: Show/Hide Uncertainties, Connect: Connecting Lines ,
Rejected: Show/Hide rejected data, Full View: Show all data,
and
Change Plot Variable, Exploring Details,
Compressibility(Z) and Data Point identification in a plot.
DATA COLORS:
Black = Accepted Data, Orange = Rejected Data,
Red = Select Data, Blue = Data estimated by TDE
Blue Lines = Default equation representations evaluated by TDE,
Green Lines = User selected equations
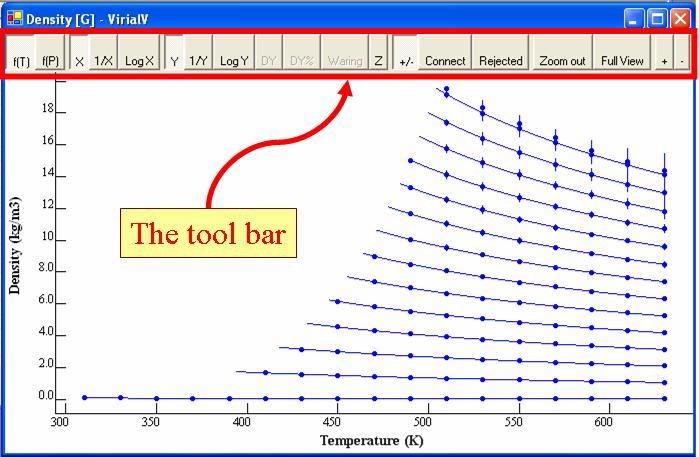
The example shows plots of density = f (T & p) for quinoline after evaluation (from the Default Representations branch of the tree).