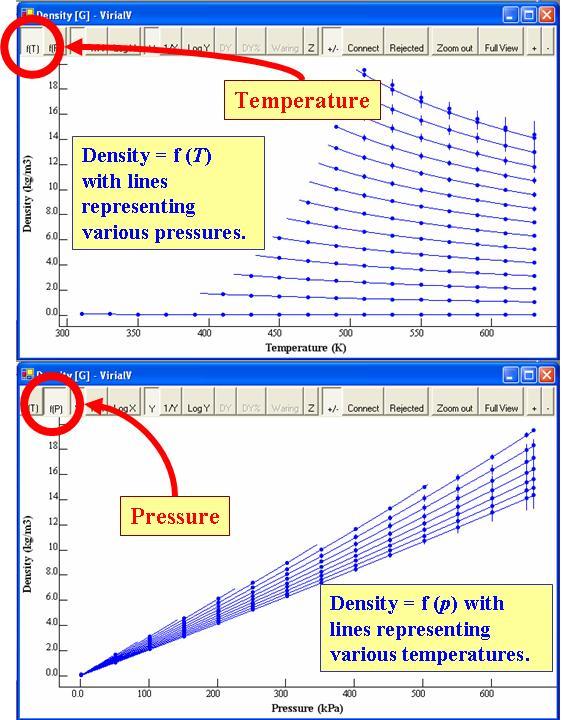
Alternative Views:
Properties can be plotted as a funtion of
temperature
(
T
) or
pressure
(
p
).
The example shows a plot of density = f (
T
) and f(
p
) for
o-xylene
after evaluation.