Display of calculated VLE Isotherm (no experimental data)
Isothermal evaluated results (no experimental data) are displayed as shown here.
Plots of evaluated data are accessed through the Calculated with Multi-Property Equations tree node.
The Display for Azeotropic Data includes some additional features.
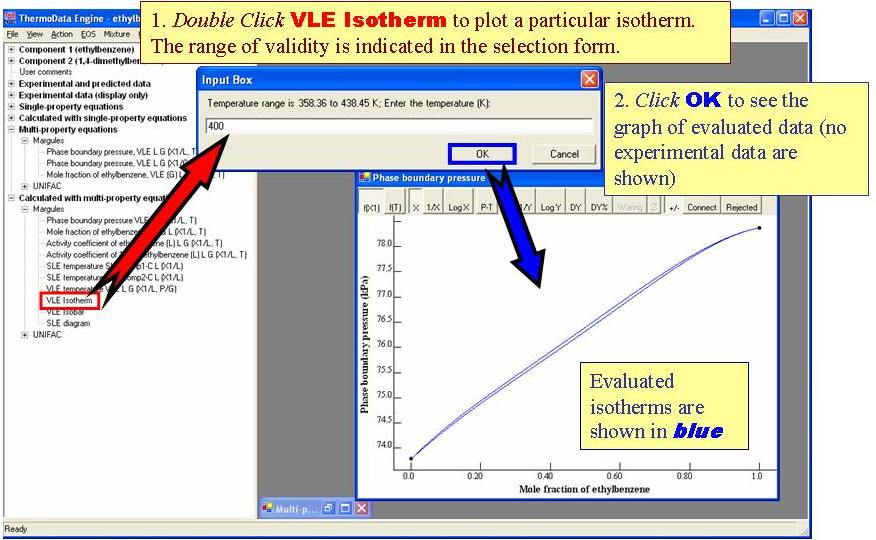
The plot shows isothermal VLE data (with no azeotrope) for the system (ethylbenzene + p-xylene).