Singular properties (no state variables)
Singular properties are displayed on regular 2D plots, where X represents the ordinal numbers of the shown values in the Data Table. Typical plots include critical properties, triple point temperatures, enthalpies of phase transitions or enthalpies of formation (at 298.15 K) for pure compounds, binary eutectic point at vapor saturation and some other invariant points for mixtures.
Available actions are controlled through the toolbar or by right-clicking.
PLOT TYPES (available by expanding the Y box):
DY: Deviation Plot , DY%: Percent Deviation Plot
PLOT FEATURES:
Available from the toolbar: +/-: Show/Hide uncertainties, Rejected: Show/Hide rejected data, Zoom out: Show a larger area of the plot, Full View: Adjust the X and Y axes to show all data.
Other features include Exploring Details & Resizing, Data Point identification in a plot, and Right-Click Features.
DATA COLORS:
See Colors in TDE Plots
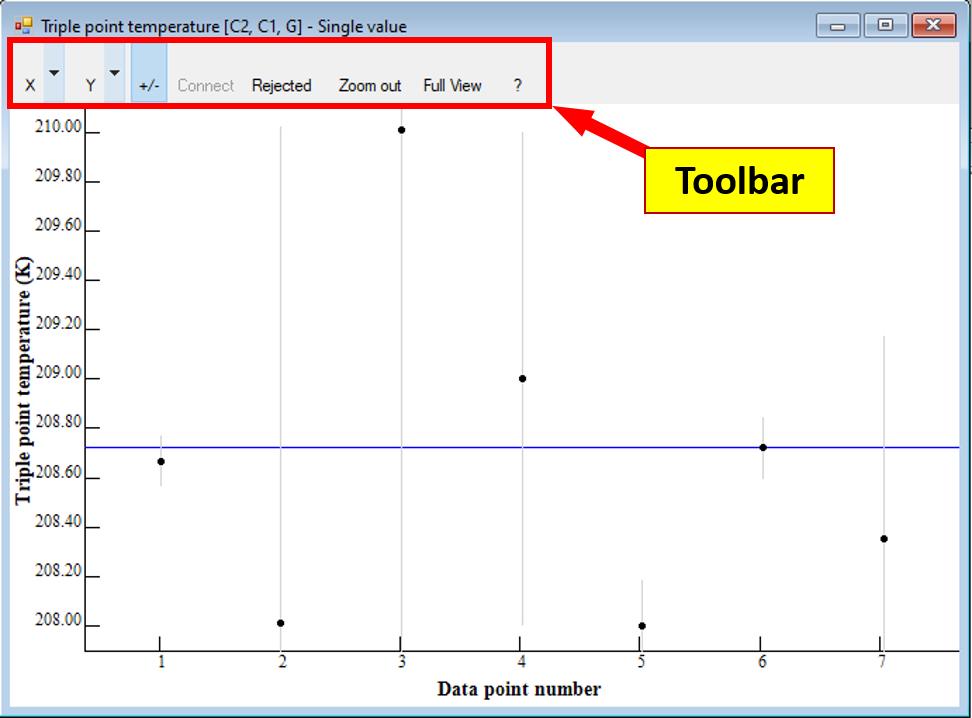
This example shows the triple-point temperature (crystal 2, crystal 1, gas) for adamantane.