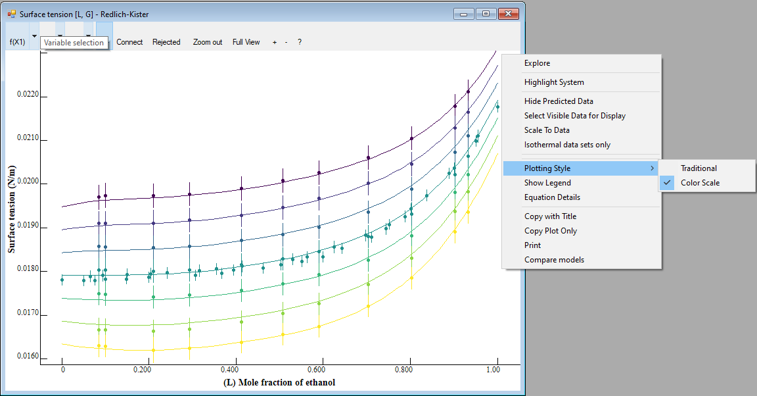
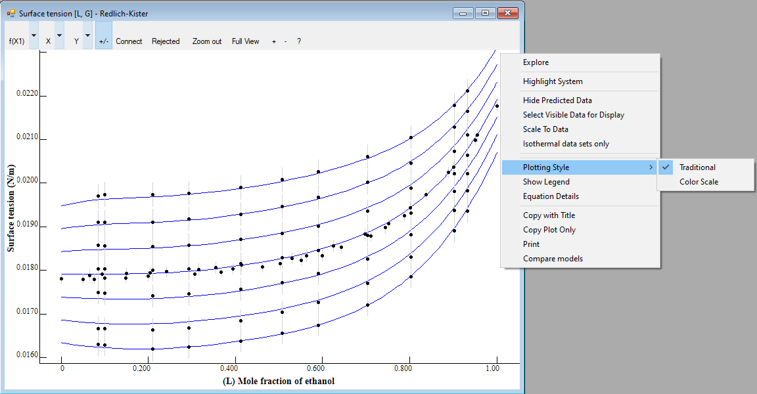
Plotting style
This right-click context menu allows switching between Traditional and Color Scale styles for properties with at least two state variables or for different compounds in Compound Comparisons.
In the example plots below for surface tension of ethanol + hexane as a function of mole-fraction composition and temperature, temperature is the background variable. The color change from purple to yellow shows the variation of the background variable from low to high (respectively). Though the example plots are of binary mixtures, any two variable pure compound plots with will look similar.
Traditional:
Color Scale: