Data as a function of 2 or more variables
Available actions are controlled through the toolbar or by right-clicking.
The X and Y axes can have different representations available from the drop-down menus (simple, inverse, or log10). For mixtures, TDE allows plotting also log10(X1/X2) or log10(Y1/Y2), where the X or Y axes define compositions (more details about the composition-stretched representation can be found in the following article: V. Diky. An Efficient Way of Visualization of Mutual Solubility Data in the Whole Range of Compositions. J. Chem. Eng. Data 62, 2920 (2017); https://dx.doi.org/10.1021/acs.jced.7b00174.
PLOT TYPES (available by expanding the Y box):
DY: Deviation Plot , DY%: Percent Deviation Plot, Z: Compressibility Factor Plot (for density)
PLOT FEATURES:
Available from the toolbar: +/-: Show/Hide uncertainties, Connect: Show/Hide lines connecting iso-variable subsets (in terms of background variables, multi-variable properties), Rejected: Show/Hide rejected data, Zoom out: Show a larger area of the plot, Full View: Adjust the X and Y axes to show all data.
Other features include Changing Display Variable, Changing Line Density, Exploring Details & Resizing, Data Point identification in a plot, and Right-Click Features.
DATA COLORS:
See Colors in TDE Plots
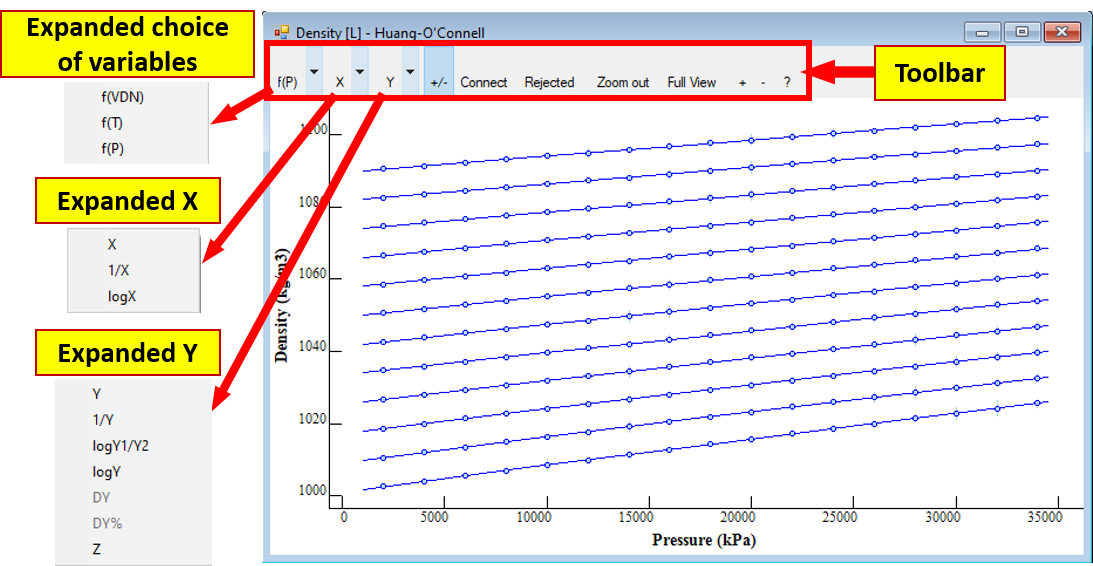
This example shows the density = f(T, p) for liquid quinoline after evaluation (from the Evaluated Data node of the Navigation Tree).