Plot: Right-Click Features
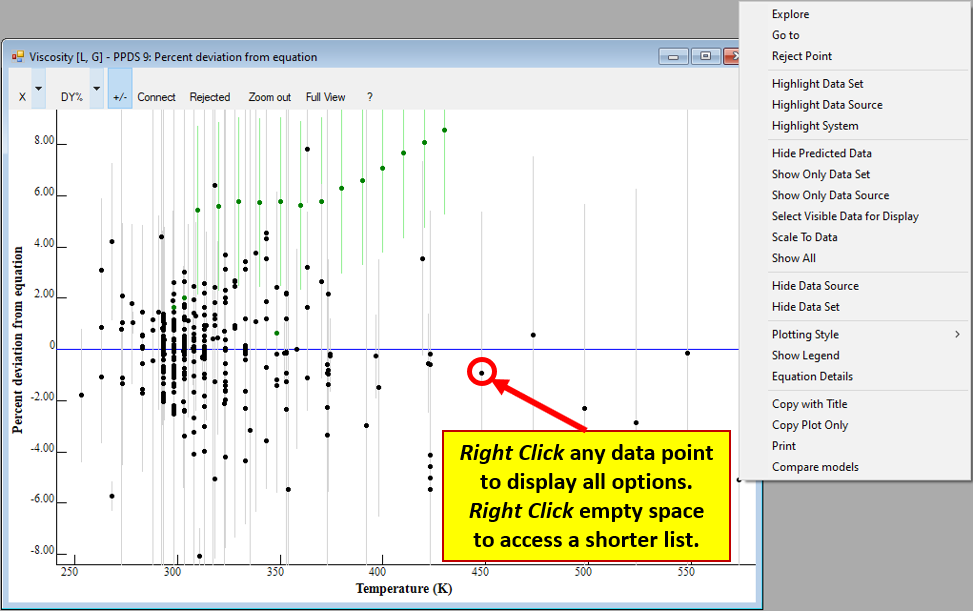
The full option list accessible by right clicking a data point (in any coordinate representation) includes:
- Explore: Display data point details
- Go To: Display the selected data point in the Data Table
- Reject Point: Reject the selected data point
- Highlight Data Set: Highlight the entire data set on the plot
- Highlight Data Source: Highlight all data from a bibliographic source
- Highlight System: Highlight all data for a system of interest when several systems are compared
- Show/Hide Predicted Data: Show or hide data predicted in TDE by available methods
- Show Only Data Set: Show only the data set associated with the selected point
- Show Only Data Source: Show only the data source associated with the selected point
- Select Visible Data for Display: Show only the current visible data in any plot re-formats
- Scale To Data: Adjust the plot scales for more efficient representation of selected data on a plot
- Show All: Add all data points from the associated Data Table to the plot
- Hide Data Source: Hide all data from a bibliographic source
- Hide Data Set: Hide all data from a data set
- Plotting Style: Switch between Traditional and Color Scale styles
- Show/Hide Legend: Display or hide the legend on the plot.
- Equation Details: Show parameters for the fitted equation
- Copy with Title: Copy the plot to the Clipboard. Include a plot title.
- Copy Plot Only: Copy the plot to the Clipboard. Do not include the title.
- Print: Send a copy of the plot to the printer.
- Compare models: Add one or more generated alternative equations or EOS to the current model for comparison
A shorter option list which includes selected options from the full list is also accessible by right clicking empty space on a plot.