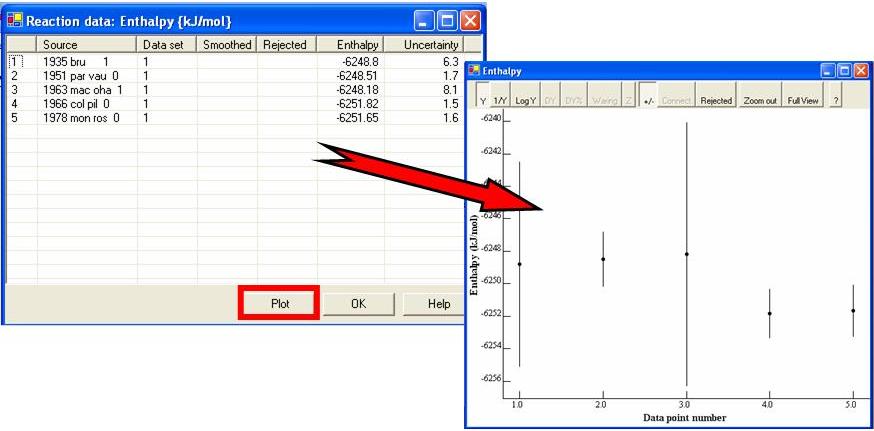
Graphical representation of
Enthalpies of Combustion
Values (with uncertainties) are plotted chronologically with the horizontal axis corresonding to the
data point numbers
(
i.e.
, the first column of the
Data Table
).