Black = Accepted Data, Orange = Rejected Data, Red = Select Data, Blue = Data estimated by TDE
Blue Lines = Default equation representations evaluated by TDE, Green Lines = User selected equations
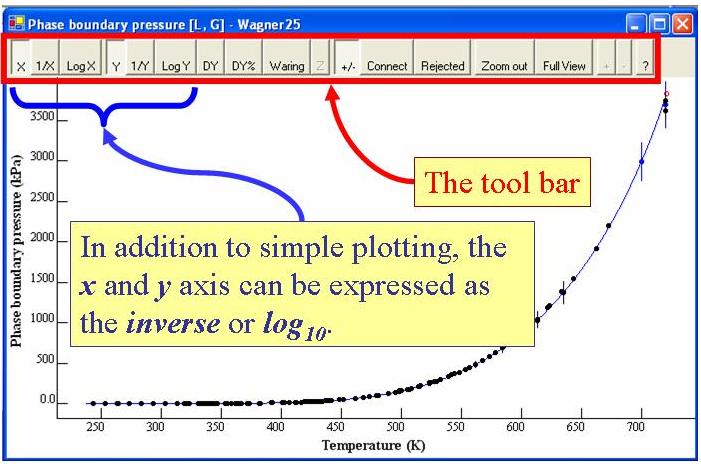
PLOT TYPES:
DY: Deviation Plot , DY%: %Dev Plot ,
Waring: Waring Function Plot
PLOT FEATURES:
+/-: Show/Hide Uncertainties, Connect: Connecting Lines ,
Rejected: Show/Hide rejected data, Full View: Show all data,
and
Exploring Details & Resizing, and Data Point identification in a plot.
DATA COLORS:
Black = Accepted Data, Orange = Rejected Data,
Red = Select Data, Blue = Data estimated by TDE
Blue Lines = Default equation representations evaluated by TDE,
Green Lines = User selected equations