Navigation Tree
:
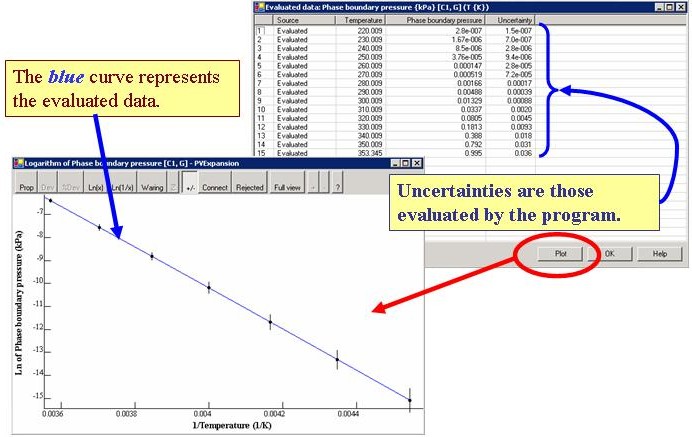
Tables and Plots of Evaluated Data
The density of data points can be specified by the user with the
Evaluated Data form
.