Graphical representation of Enthalpies of Combustion
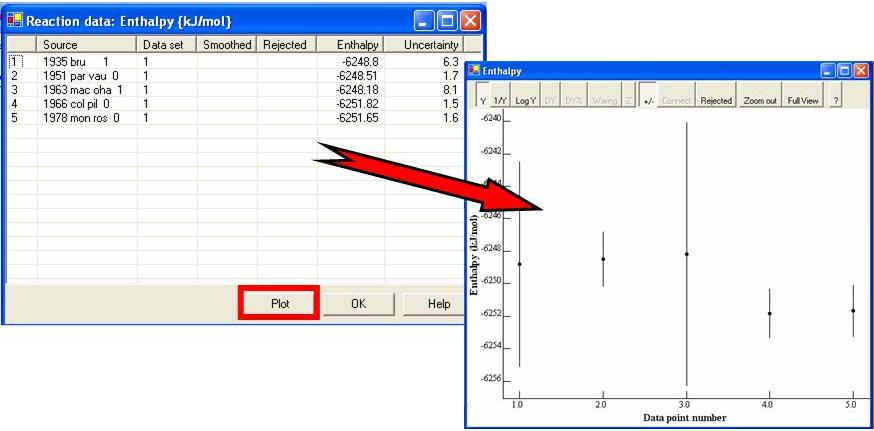
Values (with uncertainties) are plotted chronologically with the horizontal axis corresponding to the data point numbers (i.e., the first column of the Data Table).
Values (with uncertainties) are plotted chronologically with the horizontal axis corresponding to the data point numbers (i.e., the first column of the Data Table).