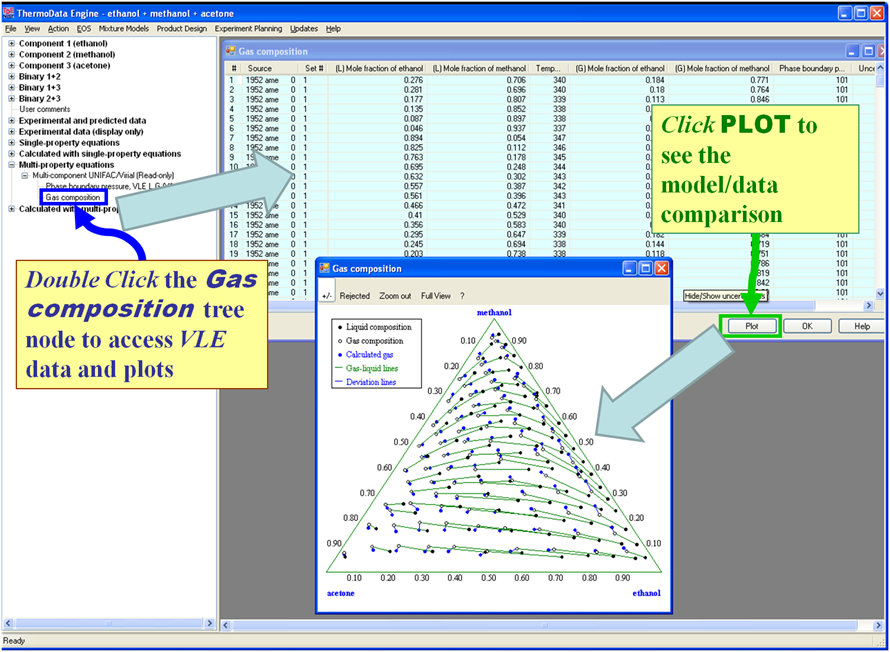
Navigation Tree (Ternaries): Multi-Property Equations - VLE Model/Data Comparisons
- Experimental liquid compositions are represented by the black dots.
- Experimental gas compositions are represented by the open circles.
- Gas compositions calculated with the model are represented by the blue dots.
- Experimental liquid-gas tie-lines are represented by the green lines.
- Deviations between the gas compositions determined by experiment and with the model are represented by the blue lines.