Display of calculated VLE Isobar (no experimental data)
Isobaric evaluated results are displayed as shown below.
Plots of evaluated data are accessed through the Calculated with Multi-Property Equations tree node.
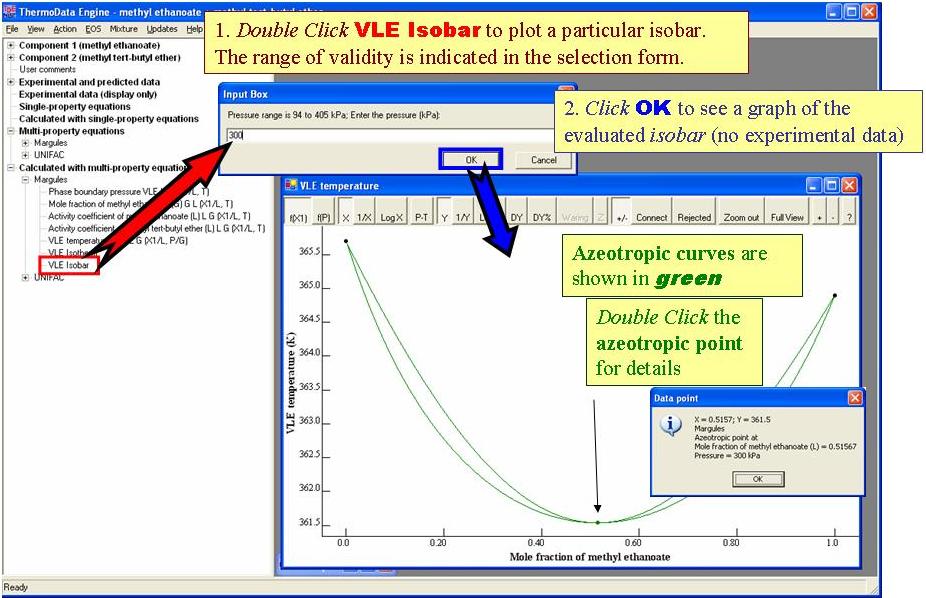
The plot shows isobaric VLE data (with an azeotrope) for the system (methyl ethanoate + methyl tert-butyl ether).