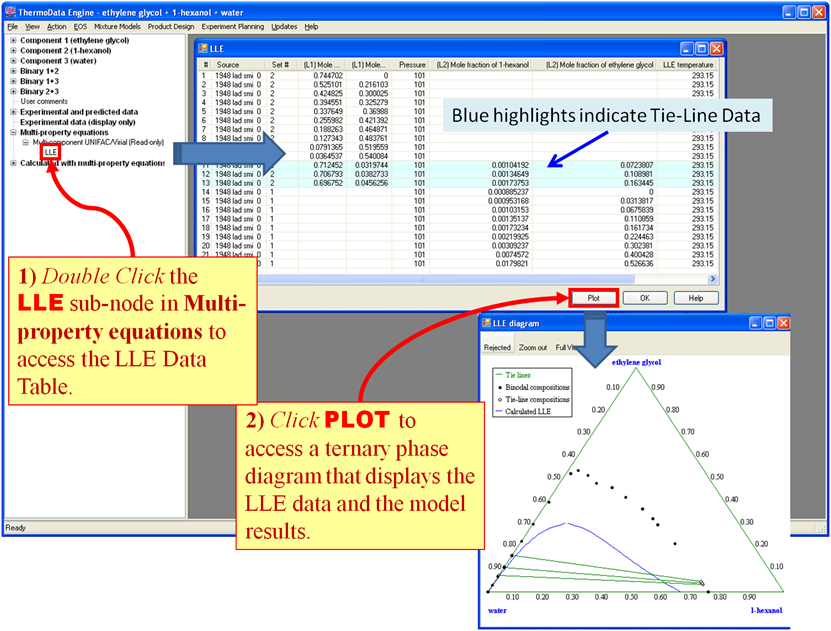
Display of calculated LLE Diagram (with experimental data & modeling results)
The plot shows isobaric (p = 101.3 kPa) LLE data & modeling results for the system (1-hexanol + water + ethylene glycol).
The green connecting lines in the figure indicate LLE tie-line data. Numerous Plot Exploration Features are available.
Note: All ternary models are based on those for the binary sub-systems. Experimental data for the ternary system may be compared with the model results, but are not included in any fitting procedures.