Changing Line Density
This function is available for the following cases of multi-variable properties:
- graphs showing experimental points, when lines connecting iso-variable subsets are shown
- graphs showing models' curves
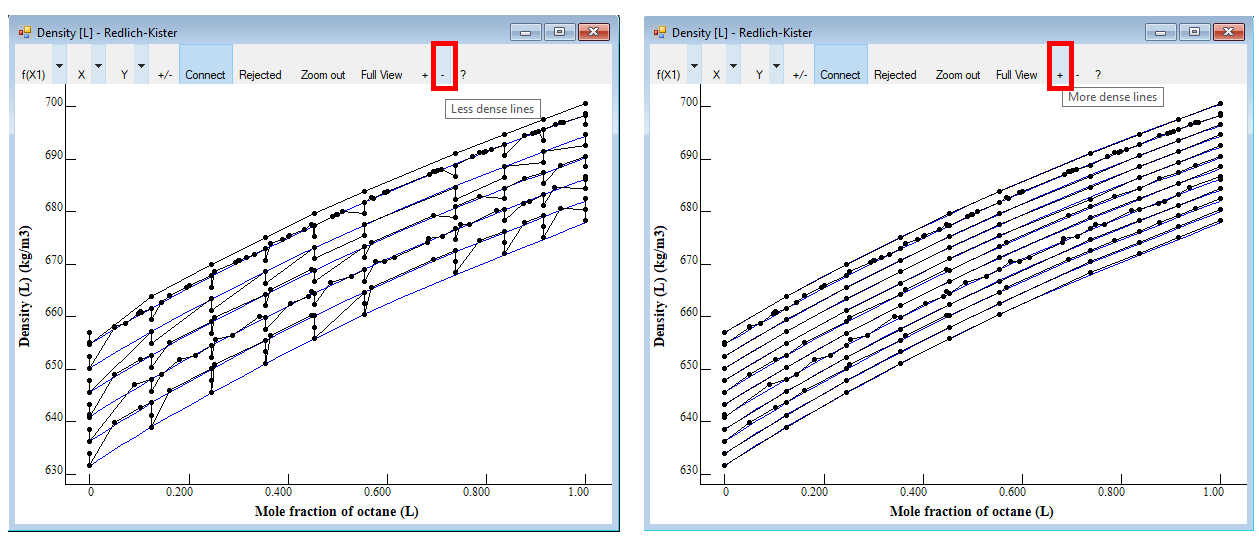
“+” increases the density of model curves (if present) and narrows the bands where experimental data points are connected (if connection is activated)
“–“ has the opposite effect.
Example: experimental density data for octane + hexane: