Changing Display Variable.
Changing Display Variable: Multivariable property plots allow selecting the display variable available from the leftmost drop-down menu in the toolbar.
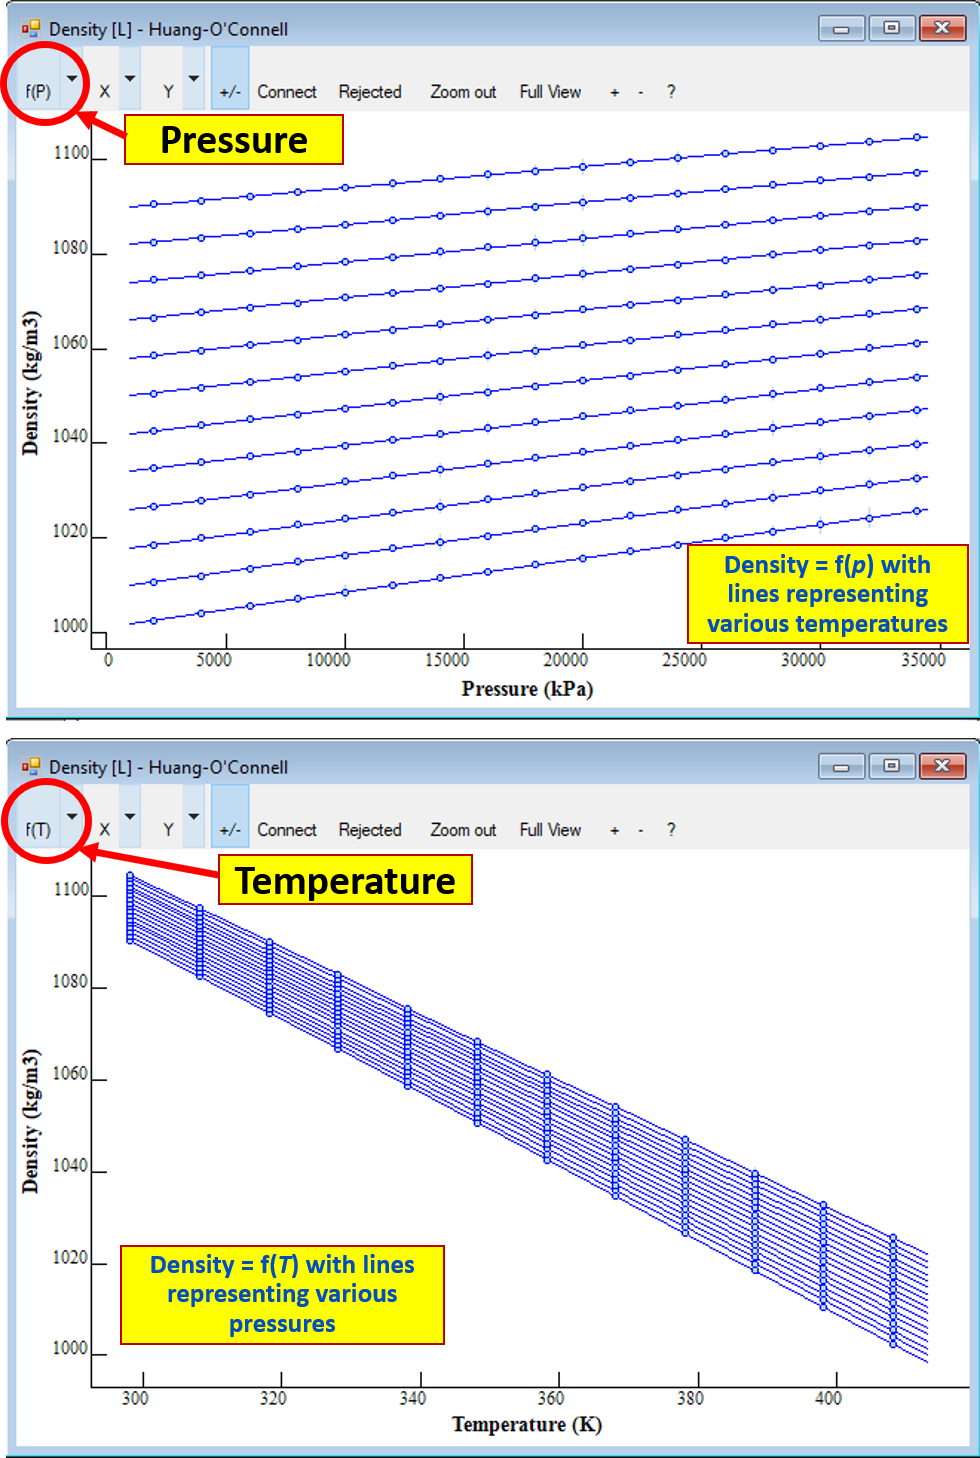
This example shows the density = f(T, p) for liquid quinoline after evaluation (from the Evaluated Data node of the Navigation Tree).