Model Comparison in TDE
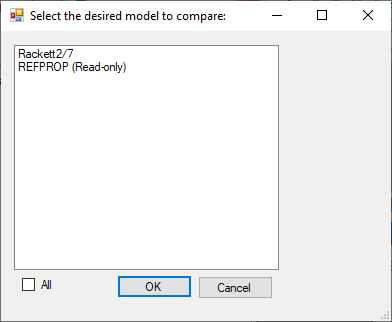
If multiple models are available for a compound or mixture property, the models can be compared. The comparison always starts from a plot presenting any of those models. It is done by right-clicking on the plot and calling context menu command Compare models and selecting available models to be compared with the model representing the plot.
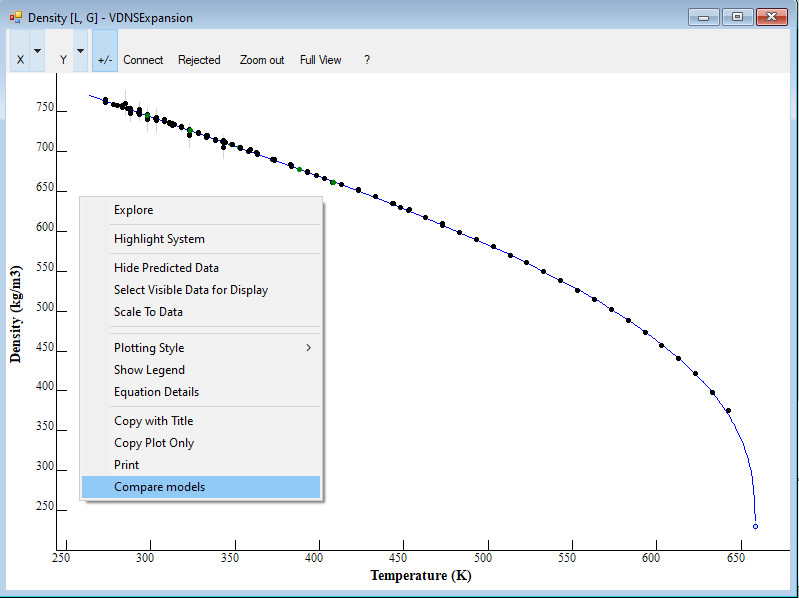
The models, which can be compared, include default equations, equations of state (for pure compounds), alternative equations (for pure compounds), AC models (for mixtures), and SDS equations (for mixtures).
For pure compounds:
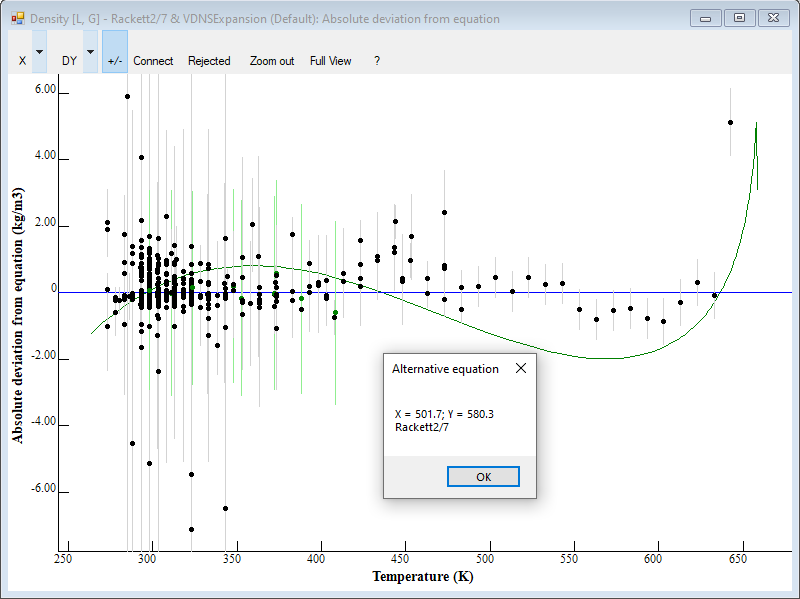
The example shows default equation for saturated liquid density (VDNSExpansion) for dodecane compared with an alternative equation (Rackett2/7). The primary model (whose plot is called) is shown as a blue curve. The alternative model(s) are shown as green curves. For deviation plots, the deviations of experimental data and the alternative models are shown relative to the primary model. Double-clicking on the curve gives the model name.
For mixtures:
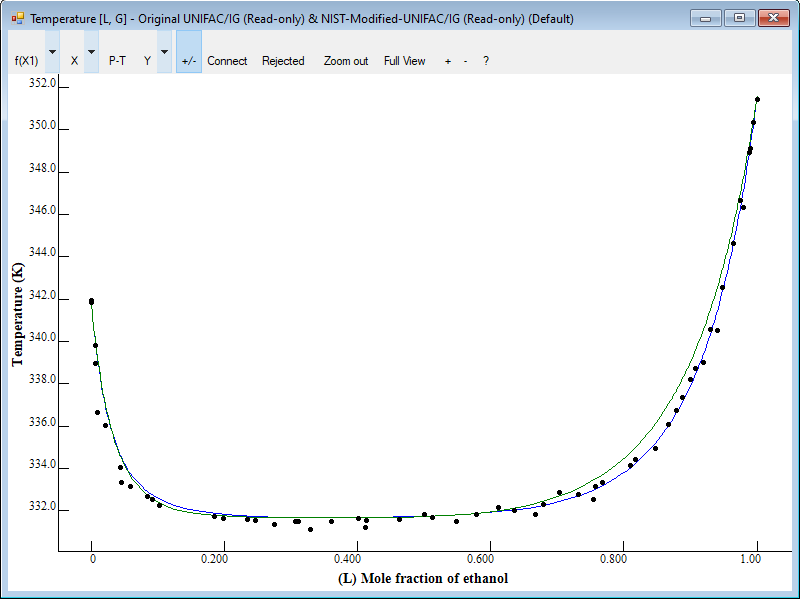
The example shows comparison of the VLE boiling temperatures at 101 kPa for ethanol + hexane calculated with NIST-Modified UNIFAC (blue curve) vs Original UNIFAC (green curve). Double-clicking on the curve gives the model name.