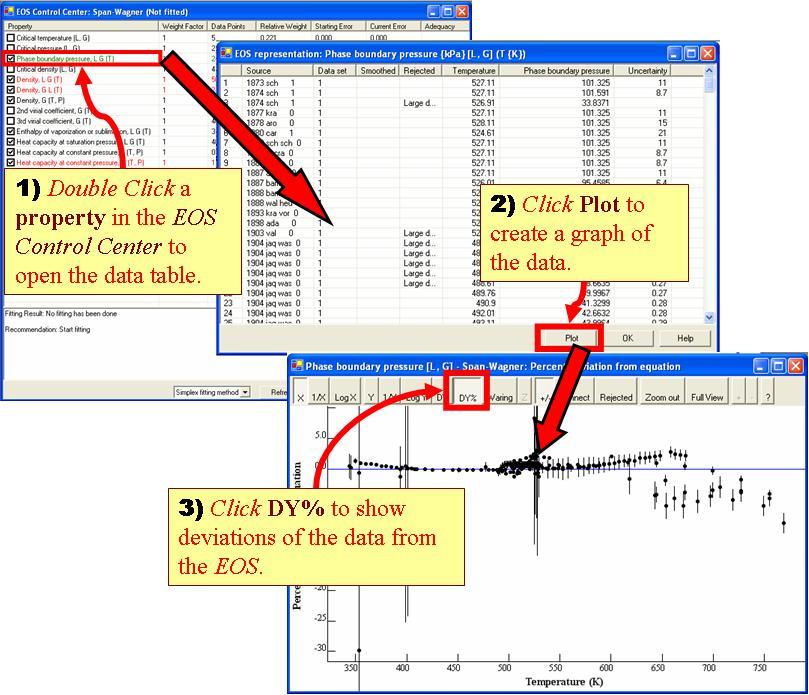
Model Fitting Control Center: Deviation Plot: Experimental & Predicted Data from EOS
Analogous plots can be made by accessing the property data through the Equations of State node in the Navigation Tree.
Analogous plots can be made by accessing the property data through the Equations of State node in the Navigation Tree.