Review results of EOS fit: Deviation Plots
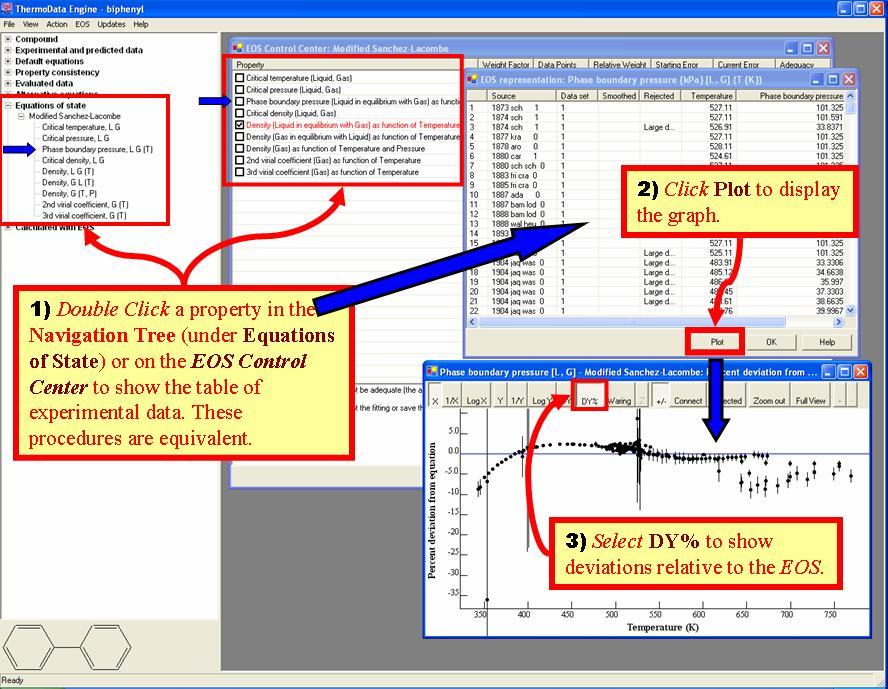
The example shows application of the Modified Sanchez-Lacombe EOS to data for biphenyl. The deviation plot shown is for vapor pressures (i.e., pressures for the L-G phase boundary)
The example shows application of the Modified Sanchez-Lacombe EOS to data for biphenyl. The deviation plot shown is for vapor pressures (i.e., pressures for the L-G phase boundary)