View data calculated with the EOS
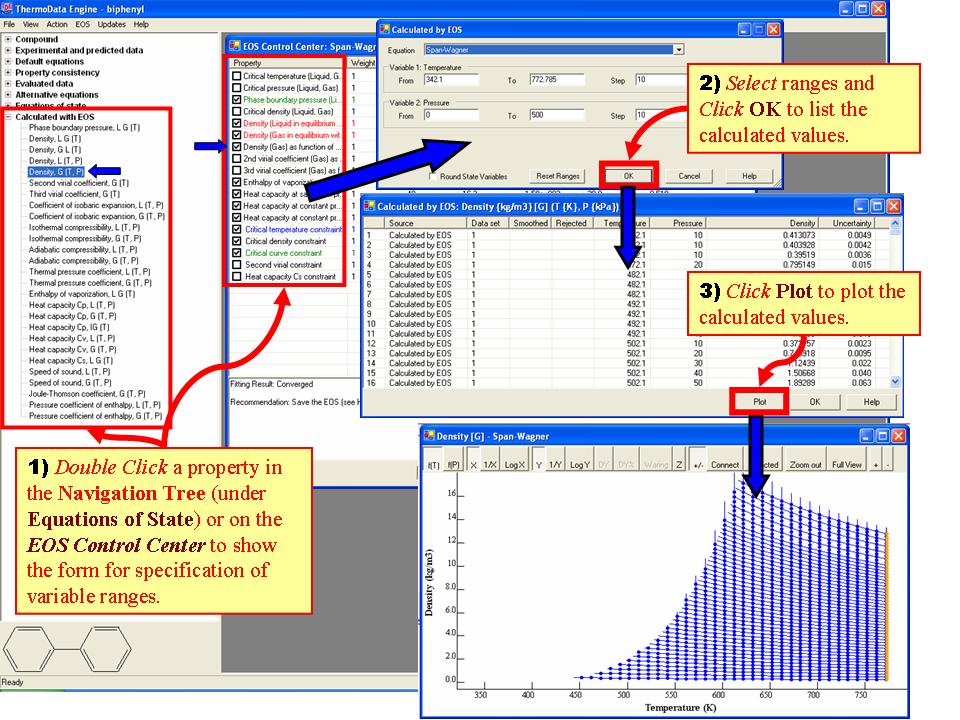
The example shows application of the Span-Wagner EOS to data for biphenyl. The plot shown is for unsaturated gas density (i.e., densities of a single-phase sample of gas)
The example shows application of the Span-Wagner EOS to data for biphenyl. The plot shown is for unsaturated gas density (i.e., densities of a single-phase sample of gas)