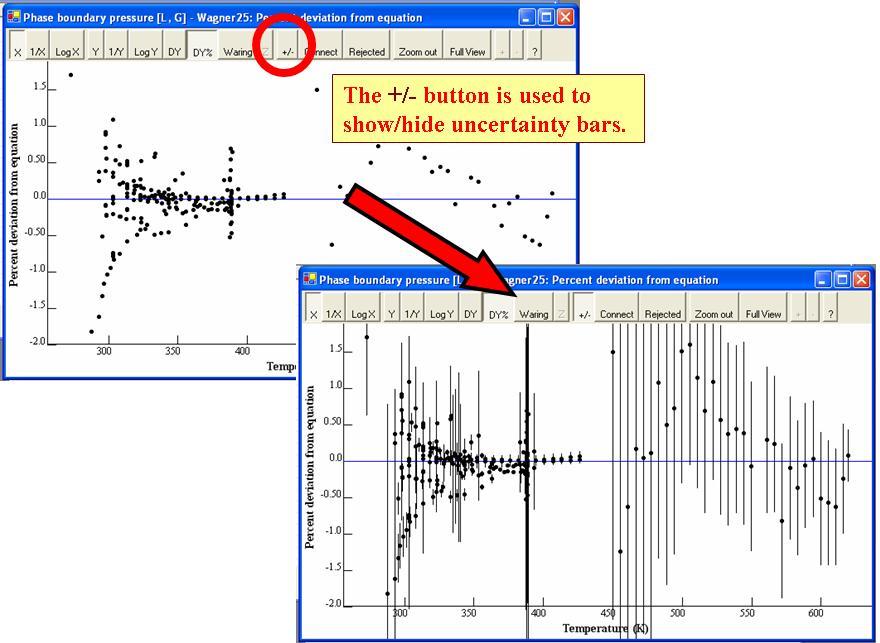
The +/- button shows/hides estimated uncertainties for the plotted data points.

NOTE: The +/- ranges indicate approximate uncertainties for the experimental values, except in the Recommended Values branch of the Navigation Tree, where they represent uncertainties for the recommended values.