Vapor-Liquid Equilibrium (VLE) Data Summary View: Ternary Mixtures
Purposes & Features:
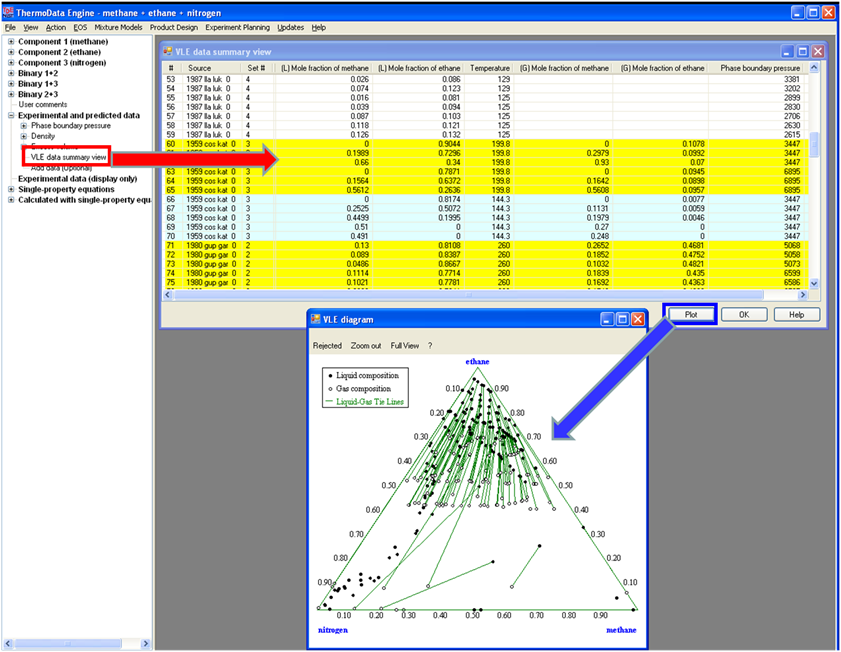
Summarize VLE Data in one table: VLE data are reported in a variety of forms ( PTxy, PTx, Txy). All VLE data types are shown in a single table accessed through this node (See Figure).
Identify PTx'x"y'y" Data Sets: PTx'x"y'y" data are highlighted in the table for easy identification (See Below). After evaluation for the pure components, data sets at conditions that are supercritical for any component are highlighted in yellow.
Plotting: The data can be plotted as a ternary diagram. Liquid-gas tie lines are shown in green.