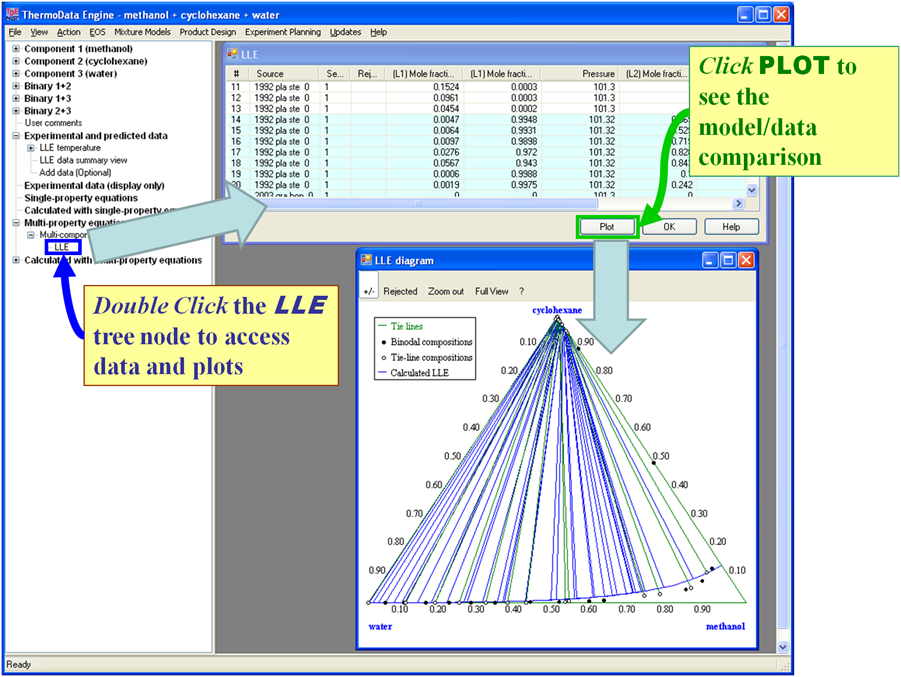
Navigation Tree (Ternaries): Multi-Property Equations - LLE Model/Data Comparisons
- The model is represented by the blue lines. The binodal curve and representative tie-lines are shown.
- Experimental binodal compositions are represented by the black dots.
- Experimental tie-line compositions are represented by the open circles connected with green lines.